CAPA (Corrective and Preventive Action) is the quality-system process that finds the root cause of a problem, removes it so it cannot recur, and stops similar problems from appearing elsewhere. This guide walks through the full process, the tools, the records, and the metrics, with worked examples from incoming and outgoing inspection (IQC/OQC).
1. What CAPA is and why it matters
Removing or repairing the defective part alone is not sufficient to constitute a CAPA. CAPA asks why the defect happened, changes the system that allowed it, and then proves the change worked. Three terms are often mixed up, so keep them apart:
| Term | Question it answers | Triggered by | IQC/OQC example |
|---|---|---|---|
| Correction | How do we fix this nonconforming item now? | A detected nonconformity | Sort, rework, or reject the nonconforming units found in the 5,000-unit lot |
| Corrective action | Why did it happen, and how do we stop it recurring? | An existing nonconformity | Change the supplier's packing method after finding the cause of transit damage |
| Preventive action | What could go wrong, and how do we stop it before it does? | A potential nonconformity or trend | Review similar materials for the same tool-wear mechanism and add tool-life control or automatic offset adjustment before the drift occurs |
ISO 9000:2015 defines the last two by their target: corrective action eliminates the cause of a detected nonconformity, preventive action eliminates the cause of a potential one. ISO 9001:2015 no longer has a separate preventive action clause; it addresses this through risk-based planning (clause 6.1), not simply a renamed preventive action procedure. Medical device and pharmaceutical systems still keep CAPA as a named process. Extra inspection is a detection control; it is not automatically a preventive action.
Containment sits alongside correction but serves a different purpose. Containment is the immediate defensive shield: it stops the problem from spreading to stock, work in progress, and customers. Correction is the localized fix of the nonconforming items already found, such as sorting or reworking a lot. Start containment immediately and perform correction as soon as the disposition is authorized and safe to execute; neither removes the cause.
Standards that require CAPA
| Standard | Clause | What it requires, in short |
|---|---|---|
| ISO 9001:2015 | 10.2 Nonconformity and corrective action | React to the nonconformity, evaluate the need to remove the cause, implement action, review its effectiveness, update risks, keep documented evidence |
| ISO 13485:2016 | 8.5.2 Corrective action, 8.5.3 Preventive action | Documented procedures; review nonconformities including complaints; determine causes; verify the action does not harm product safety; verify effectiveness |
| FDA Quality Management System Regulation (QMSR), 21 CFR Part 820 | Quality system requirements, including CAPA | The former 820.100 required analysis of quality data, cause investigation, action verification, information sharing and management review; these themes now come through ISO 13485. Effective 2 February 2026, the QMSR incorporates ISO 13485:2016 by reference together with FDA-specific provisions, and applies to manufacturers of finished medical devices for U.S. commercial distribution. Check the current regulation and FDA guidance for what applies to a given product |
| IATF 16949:2016 | 10.2.3 Problem solving, 10.2.4 Error-proofing | A documented problem-solving process with a defined root-cause method, systemic corrective action and error-proofing |
| ICH Q10 | 3.2.2 CAPA system | A CAPA system as a core element of the pharmaceutical quality system, feeding management review |
Check which of these your customers and certification bodies actually audit you against; the required level of documentation differs between a general ISO 9001 system and a regulated product line. Pharmaceutical and medical device expectations do not automatically apply to other industries.
2. The CAPA lifecycle
Every CAPA moves through the same eight stages. Effectiveness verification is a critical stage that is sometimes overlooked; it provides documented evidence that the actions achieved their intended results.
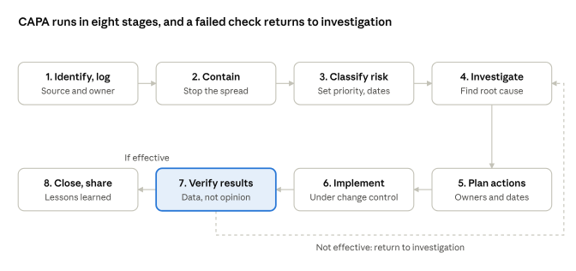
A CAPA that fails its effectiveness check goes back to stage 4, not forward to closure. The timelines below are typical starting points; section 4 tightens them for high-risk problems.
| Stage | Owner | Key output | Typical timeline |
|---|---|---|---|
| 1. Identify and log | QC Officer | CAPA number, problem statement with data | Day 0 |
| 2. Contain | QC Officer with Production | Quarantine record, sorted stock, quantities | Within 24 hours |
| 3. Classify risk | QA Manager | Priority level and due dates | Within 2 working days |
| 4. Investigate | Cross-functional team | Root cause statement with evidence, plus the escape cause | 10 to 30 working days, by priority |
| 5. Plan actions | CAPA owner | Approved action plan and effectiveness criteria | Within 5 working days of root cause |
| 6. Implement | Action owners | Evidence for every action | Per plan, usually 30 to 60 days |
| 7. Verify results | QC Officer | Effectiveness report with data | Set by failure frequency, volume and risk: several months, or a set number of lots |
| 8. Close and share | QA Manager | Closure record and lessons learned | Within 5 working days of a passed check |
3. Triggers: when to open a CAPA
Open a CAPA when the cause of a problem sits in the system and could cause it again; fix locally when it is a contained one-off. A nonconformance report (NCR) records and dispositions the item; a CAPA fixes the reason it happened.
Where CAPAs come from
| Source | Typical signal | Example |
|---|---|---|
| Incoming inspection (IQC) | Rejected lot, repeat defect from one supplier | Third dimensional rejection from the same vendor in a quarter |
| In-process inspection | Rising scrap or falling first-pass yield | Yield on a line drops two points over three weeks |
| Outgoing inspection (OQC) | Failed AQL lot, customer-critical defect found at shipping | Label error found on a packed export lot |
| Customer complaints and returns | Repeat complaint theme, any safety or regulatory complaint | Two customers report the same seam failure |
| Internal and external audits | Major nonconformity, or repeated minor findings | Calibration records missing in two audits running |
| Process data (SPC) | Out-of-control signal, falling Cpk | A predefined trend rule is triggered, such as seven consecutive rising points, where the charting procedure defines it |
| Supplier performance | Poor quality score, repeated supplier corrective action requests (SCAR) | Supplier ppm above target for three months |
| Equipment and calibration | Instrument found out of tolerance | Caliper fails post-use check, so past measurements need review |
| Risk review and management review | Risk rated high, or a trend across several areas | FMEA score rises after a process change |
Open a CAPA or fix locally?
Answer these in order. A single “yes” is enough to open a CAPA. The thresholds are examples; set your own in the CAPA procedure.
| Question | If yes |
|---|---|
| Could it affect safety, regulatory compliance, or a customer-critical characteristic? | Open a CAPA |
| Has it happened three or more times in six months, or in more than one lot? | Open a CAPA |
| Could the same cause affect other products, lines, or suppliers? | Open a CAPA with a preventive scope |
| Did a customer, auditor, or regulator ask for a formal response? | Open a CAPA, or an 8D if the customer requires one |
| Is the cost of failure above your set threshold? | Open a CAPA |
| None of the above, and the cause is clear and already removed | Correction plus an NCR record; trend it and review monthly |
Watch the monthly NCR trend even for local fixes. Three apparently isolated NCRs with the same underlying cause may indicate that a CAPA should have been opened earlier.
4. Risk-based classification
Score every problem for severity and occurrence, then let the score set how fast the CAPA must move. Severity 5 always escalates as critical, regardless of occurrence.
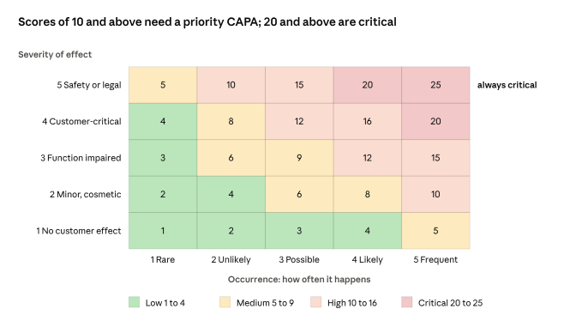
This 5 × 5 matrix is a general risk assessment tool for triaging CAPAs at the inspection bench. It is not an FMEA score. AIAG/VDA FMEA uses 1 to 10 scales for severity, occurrence, and detection, and the 2019 handbook ranks risk by Action Priority instead of a multiplied RPN. Do not mix the two scales in one record; state which method a score came from. Priority comes from the defined bands; some integers, such as 7 or 11, cannot occur as products of two 1 to 5 scores.
| Priority | Score | Containment | Root cause due | Actions complete by | Who is told |
|---|---|---|---|---|---|
| Critical | 20 to 25, or any severity 5 | Within 24 hours | 10 working days | 45 days | Top management at once |
| High | 10 to 16 | Within 48 hours | 20 working days | 60 days | QA Manager and department heads |
| Medium | 5 to 9 | Within 5 working days | 30 working days | 90 days | QA Manager |
| Low | 1 to 4 | Correction, recorded through the nonconformity process | If a CAPA trigger from section 3 is met, open a CAPA regardless of the low score | Set by risk, applicable requirements and company procedure | Logged in the monthly NCR trend review |
These response times are examples. Set yours in the CAPA procedure and keep them achievable; a target that is missed every month teaches people to ignore it. These dates cover containment, root cause, and implementation. Final closure is separate: close a CAPA only after all actions are done, and the effectiveness criterion in section 8 is met. If a CAPA runs past its target, record the justification, escalate, and keep interim controls in place; never close it just to meet a deadline.
5. Containment and investigation
Contain first, then investigate with data. Containment protects the customer today; it does not remove the cause.
Containment checklist
- —Stop use or shipment of the suspect material and tag it with a hold label.
- —Trace every affected lot: stock, work in progress, finished goods, and anything already at the customer.
- —Where feasible and appropriate to the risk, sort or inspect 100% of suspect units against the failed characteristic, or use an approved alternative containment method, and record accepted, reworked and rejected counts.
- —Tell production, purchasing, the supplier and, where needed, the customer.
- —Add interim protection, such as tightened sampling, until the cause is removed.
Evidence to collect
| What | Question | Examples of evidence |
|---|---|---|
| Product | Which items, and how many? | Lot and batch numbers, quantities, photos, failed samples |
| Process | What was running? | Machine, tool, settings, shift, operator, date and time |
| Measurement | Can the measurement be trusted? | Gauge ID, calibration status, repeatability check |
| Change history | What changed recently? | Drawing revisions, material or supplier changes, maintenance |
| History | Has it happened before? | Past NCRs, earlier CAPAs, audit findings |
Worked example: find the vital few
Across lots L-1041 to L-1049, IQC sampled 1,200 units and recorded 100 defects, one per defective unit (so 100 rejected units). A Pareto chart ranks defect types by count so the team investigates what matters most first. The numbers here are illustrative.
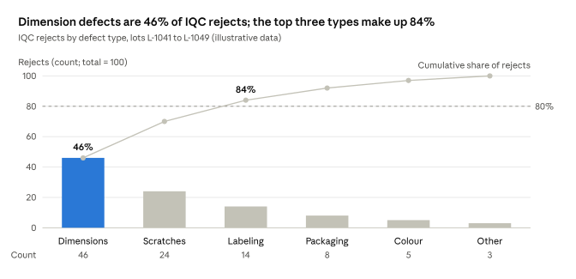
Width tolerance alone is 46 of the 100 defects, so it becomes the CAPA focus. Scratches and labeling are real but smaller; handle them with routine corrections or separate CAPAs if they grow.
6. Root cause analysis
Root cause analysis separates the visible symptom from the system cause. Stop only when you reach a cause you can fix and prove with evidence.
Choose the tool for the problem
| Tool | Best for | Strength | Watch out for |
|---|---|---|---|
| 5 Whys | One clear chain of cause, simple problems | Fast, no software, easy to teach | Stops early; needs evidence at every why |
| Fishbone (Ishikawa) | Many possible causes, team brainstorm | Sorts ideas into Method, Machine, Material, People, Measurement, Environment | Lists candidates, not proof |
| Is / Is-Not analysis | Narrowing down where, when, and how much | Compares what is affected with what is not | Needs data on both sides |
| Pareto analysis | Deciding which defect or cause matters most | Ranks by count or cost | Shows size, not cause |
| FMEA | Preventive work on new or changed processes | Identifies failure modes, effects, and causes and prioritizes actions by the applicable FMEA method; feeds the control plan | Scores are subjective; revisit after real failures |
| Fault tree analysis | Safety-critical or multi-path failures | Shows how combinations of events lead to failure | Slow and needs experience |
| 8D | Customer or supplier problems that need a standard report | Fixed format with team, containment and verification | Becomes paperwork if the root cause is weak |
Brainstorm with a fishbone
Use a fishbone diagram to organize potential causes when several explanations need to be considered. Put the problem at the head, list candidate causes under the six categories, then test each one with data. Below is the worked example from the previous section; the causes are illustrative candidates.
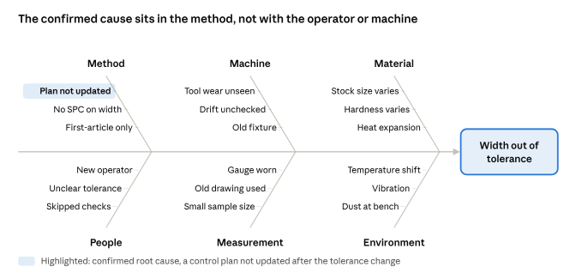
Only the control plan gap was confirmed by evidence in this example. The rest stayed on the list until data ruled them out.
Confirm with 5 Whys and evidence
Take the confirmed branch and ask why until you reach a cause in the system. Write the evidence next to each answer.
- —Why 1 — Why was the width above the limit? It drifted upward during each production run. Evidence: IQC measurements rise with piece sequence in every lot.
- —Why 2 — Why did it drift? The cutting tool wore, and no one adjusted the offset. Evidence: tool wear measurements correlated with part width, plus the supplier's tool-life and offset records, which show changes on a fixed time interval only.
- —Why 3 — Why was the offset not adjusted? The control plan had a first-article check and no in-process width check. Evidence: the supplier control plan, issued before the drawing change.
- —Why 4 — Why did the control plan lack a width check? It was written for the old tolerance of ±0.10 mm, where wear stayed inside the limit. Evidence: old and new drawing revisions.
- —Why 5 — Why was the plan not updated? Our drawing change tightened the tolerance to ±0.05 mm, but no step made the supplier acknowledge it and review its controls. Evidence: change records show no supplier acknowledgment.
Escape cause, to be investigated: whether the sampling plan suited this failure mode, whether trend rules existed, and whether IQC's measurement data could show the drift. In this example, no rule opened a CAPA on a rising trend for one characteristic. AQL sampling is not faulty just because a lot contains defects.
Test your root cause
- —If you remove this cause, would the problem stop? If not, it is a contributing factor.
- —Can you show evidence, such as data, records, or a trial, and not only an opinion?
- —Does the chain read correctly backwards, with “therefore” between each step?
- —Does it point to a system condition you can change, and not to a person to blame?
7. Action planning and implementation
Prefer actions that eliminate the cause or make the failure difficult or impossible, and validate the chosen control; the weakest actions rely on people remembering. Treat the ladder as a preference order, not a universal ranking, because some problems need several actions together. Rank every proposed action on this ladder and prefer the top rows.
| Strength | Action type | IQC/OQC example |
|---|---|---|
| Strongest | Eliminate the failure mechanism or its source where feasible | Redesign the feature or process so the failure mechanism no longer exists, with engineering and customer approval |
| Strong | Error-proof (poka-yoke) or use a more robust process | Fixture that only accepts the part in the correct orientation |
| Medium | Engineering control or automation | Automatic gauge with accept/reject signal on the incoming inspection bench |
| Weak | Detection | Extra inspection step or tighter sampling plan |
| Weakest | Administrative | Reminder, procedure rewrite, or retraining alone |
Retraining alone is rarely an acceptable corrective action for a system cause. It is fine as a support for a stronger action. Never relax a specification just to suit a supplier's difficulty; any specification change needs engineering and customer justification and formal change control.
Build a SMART action plan
Every action needs one named owner, a due date counted from CAPA approval, and evidence that it was done. The plan below belongs to the worked example used in this guide: a supplier delivering parts with the width out of tolerance after a drawing revision. All figures are illustrative.
| # | Action | Type | Owner | Due | Evidence of completion |
|---|---|---|---|---|---|
| 1 | Sort stock and WIP from affected lots with 100% gauge check | Correction | QC Officer | Day 1 | Sort record, rejected quantity |
| 2 | Move the characteristic to tightened IQC sampling until 5 consecutive lots pass (an example exit rule, valid only if justified by risk and approved; it does not replace the effectiveness check) | Interim control | QC Supervisor | Day 1 | Updated inspection plan |
| 3 | Supplier revises control plan, adds SPC on width and tool-wear offset | Corrective | Supplier Quality | Day 14 | Revised control plan, first SPC chart |
| 4 | Train IQC inspectors on the new tolerance and gauge | Corrective (support) | QC Supervisor | Day 21 | Signed training record |
| 5 | Add a drawing-revision notice with supplier acknowledgment to the change procedure | Corrective (systemic) | Engineering and Purchasing | Day 30 | Procedure revision, acknowledgment log |
| 6 | Review every supplier drawing revised in the last 12 months for the same gap | Preventive | Purchasing and QC | Day 45 | Review log, list of gaps found |
Implement under change control
- —Route any change to a procedure, drawing, specification, or inspection plan through your document and change control process, not through the CAPA form alone.
- —Check that the action does not create a new risk or break a requirement. ISO 13485 asks for this verification explicitly.
- —Collect the evidence for each action as it closes, not at the end.
- —Update the FMEA, control plan, and inspection plan so the lesson stays in the system.
- —Tell every affected team, shift, and supplier. A fix that lives on one line or one shift is a partial fix.
8. Verifying effectiveness
A CAPA is effective only if the problem stays away. Verify it with data, against criteria you set before the actions were implemented.
Pick a method that fits the cause
| Method | Use when | Example criterion |
|---|---|---|
| Trend monitoring | Recurring defects or supplier quality problems | Rejection rate at or below 1.0% for 3 consecutive months |
| Lot-based check | Low or uneven production volume | 10 consecutive lots accepted at normal inspection |
| Follow-up audit or re-inspection | Procedure or system changes | The new step found in every sampled record |
| Process capability study | Dimensional or process-control causes | Cpk of 1.33 or higher on the characteristic; confirm the level your customer requires, and use it only for a stable process with a capable measurement system |
| Complaint trend | Complaint-driven CAPAs | No repeat complaint of the same type in 6 months |
Write the criterion down at plan approval: the metric, the target, the monitoring period, who checks and by when. The period must be long enough to see the problem if it still exists, usually meaning several expected occurrences. Count lots, not calendar months: if a supplier ships once every two months, a 3-month window sees only one or two lots, which cannot prove effectiveness. For low-frequency or seasonal problems, set the criterion in lots or cycles (for example, 5 consecutive lots) and cover at least one full season.
Worked example: before and after
The worked CAPA used trend monitoring on the share of IQC lots rejected for width (lots rejected for width ÷ lots inspected that month). The target was 1.0% or lower, held for 3 consecutive months.
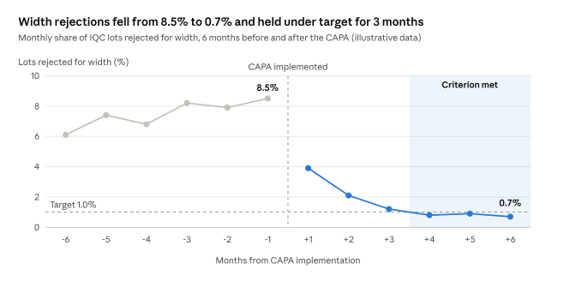
The effectiveness criterion was satisfied in month 6; the CAPA may close once all other closure requirements and QA approval are confirmed. Passing five consecutive lots earlier ended the interim tightened sampling only; it does not prove the root cause is gone. Month 3 sat just above target and did not count toward the three.
Closure criteria
- —Every action is complete, and its evidence is attached.
- —The effectiveness criterion is met, with the data in the record.
- —The actions caused no new risk, and affected documents and training records are updated.
- —QA approves closure.
- —If the check fails, reopen the investigation with a new root cause hypothesis. Extending the monitoring period without new action does not fix anything.
9. Documentation, the CAPA form and responsibilities
A CAPA without adequate documented evidence cannot be demonstrated in an audit. One form, one number, and one owner per CAPA keep the record complete.
CAPA form: field by field
| Section | Fields | What to write |
|---|---|---|
| 1. Header | CAPA number, date opened, source reference, product or supplier, initiator, CAPA owner | Link to the NCR, audit finding, complaint, or lot number that started it |
| 2. Problem description | What, where, when, how many, how detected, evidence | Facts and measurements, with photos and lot numbers; no causes or blame yet |
| 3. Risk classification | Method, severity (1 to 5), occurrence (1 to 5), risk score, priority level | Scores with the reason for each, using the internal severity × occurrence matrix in section 4; record detectability, if you assess it, as a separate note |
| 4. Containment | Actions taken, quantity affected, disposition, date | Where the suspect product is, and who checked it |
| 5. Root cause | Method used, root cause statement, evidence, escape cause | Why it happened, and why it was not caught earlier |
| 6. Action plan | Actions, type, owner, due date | The SMART table from section 7 |
| 7. Effectiveness check | Metric, criterion, monitoring period, checker, date | Defined before implementation, not after |
| 8. Approval | Names, roles, dates | QA approval of the permanent-action plan before implementation; urgent containment starts immediately under authorized procedures |
| 9. Closure | Evidence reviewed, result, closure date, lessons learned | Attach the data that proves the result |
A good problem statement is specific and measurable. Compare “Supplier parts are bad” with “46 of 1,200 inspected units (3.83%) in lots L-1041 to L-1049 exceeded the upper width limit of 12.05 mm at IQC between weeks 31 and 38 (illustrative).” A good root cause statement follows the pattern: cause, because of the condition, which allowed the effect.
Records and traceability
- —Link the CAPA to every related NCR, lot, supplier file, audit finding, and changed document.
- —Keep the evidence (photos, measurement data, training records, revised procedures) with the CAPA record.
- —Retain records for the period set by your quality manual, customer contracts, and any regulator.
- —Give each CAPA one status at all times: open, in investigation, in implementation, in effectiveness check, or closed.
Who does what
R = responsible for doing, A = accountable for the outcome, C = consulted, I = informed.
| Activity | QC Officer | QA Manager | Process or Engineering owner | Purchasing or Supplier Quality | Top management |
|---|---|---|---|---|---|
| Identify, log, contain | R | A | C | I | — |
| Classify risk and approve start | C | A/R | C | C | I |
| Investigate root cause | R | A | R | C | I |
| Plan and implement actions | C | A | R | R | I |
| Verify effectiveness | R | A | C | C | I |
| Approve closure | I | A/R | I | I | I |
| Review CAPA trends in management review | C | R | C | C | A |
10. Metrics and KPIs
Measure the CAPA system itself, not only the defects it fixes. Late closures, failed effectiveness checks and repeat issues show where the process is weak.
| KPI | Formula | Example target | What it tells you |
|---|---|---|---|
| On-time closure rate | CAPAs closed by due date ÷ CAPAs due in period × 100 | 90% or higher | Whether plans are realistic and owners are engaged |
| Overdue CAPAs | Count of open CAPAs past due date, split by priority | 0 critical | Where the backlog is hurting risk |
| Average time to action implementation | Sum of (date last action completed − open date) ÷ CAPAs with actions complete; effectiveness monitoring excluded | 60 days or less across all priorities | Speed of investigation and implementation |
| First-time effectiveness rate | CAPAs that passed the effectiveness check first time ÷ CAPAs checked × 100 | 85% or higher | Quality of root cause analysis |
| Recurrence rate | Eligible CAPAs with at least one confirmed recurrence of the same underlying root cause during the 12-month follow-up ÷ CAPAs in the eligible cohort that completed the full 12 months × 100 | 5% or less | Whether CAPAs really remove causes |
| Retraining-only share | CAPAs whose only action is training or a reminder ÷ all CAPAs × 100 | 10% or less | Over-reliance on weak actions |
| Aged CAPAs | Count of CAPAs open more than 90 days | Trending to zero | Stuck investigations |
| Supplier SCAR on-time response | SCARs answered by the due date ÷ SCARs issued × 100 | 90% or higher | Supplier engagement |
Define every KPI by period, numerator, denominator, inclusions, and rounding. On-time closure counts CAPAs whose due date fell in the quarter, first-time effectiveness counts only the first check, and recurrence is a trailing 12-month figure. Example quarterly scorecard (illustrative numbers; 24 CAPAs opened and 21 closed during the quarter; 21 CAPAs were due in the quarter; 18 were checked for effectiveness):
| KPI | Target | Result | Status |
|---|---|---|---|
| On-time closure rate | 90% or higher | 86% (18 of the 21 CAPAs due were closed on time) | Missed |
| Overdue critical CAPAs | 0 | 0 | Met |
| Average time to action implementation | 60 days or less | 47 days | Met |
| First-time effectiveness rate | 85% or higher | 83% (15 of 18) | Missed |
| Recurrence rate (trailing 12 months) | 5% or less | 2.5% (1 of 40 CAPAs with a full 12-month follow-up) | Met |
Two misses with healthy cycle times point to rushed investigations: closing fast, then failing the check. Review the root cause quality of the three failed CAPAs.
Recurrence rate: counting rules
The recurrence rate measures how often a problem returns because the same underlying root cause recurs. Apply these rules every period:
- —Include only CAPAs whose full 12-month follow-up period is complete.
- —Count each eligible CAPA once in the numerator, even if the issue recurs several times.
- —Count a recurrence only when evidence confirms the same underlying root cause; a similar-looking defect does not count without that support.
- —Use the same eligibility rules in every reporting period.
In the illustrative example, 40 CAPAs completed the follow-up and 1 had a confirmed recurrence, so the rate is 1 ÷ 40 × 100 = 2.5%.
Review rhythm
- —Weekly: a short CAPA board covering every open item, owner and due date.
- —Monthly: QA reviews the KPIs above and the aged list.
- —Quarterly or per your schedule: management review of CAPA trends, repeat themes and resource needs. Regulated systems expect CAPA data as an input to management review.
- —Yearly: review whether the CAPA procedure itself is effective, using the KPIs as evidence.
11. Common pitfalls and best practices
Most weak CAPAs fail in the same few ways, and auditors look for exactly these. Check your own CAPAs against the list.
| Pitfall | Why it fails | Better practice |
|---|---|---|
| Stopping at “operator error” | Human error is a symptom; something in the system allowed it | Ask why the instructions, tools, layout, or workload made the error possible |
| Retraining as the only action | Training fades and does not change the process | Pair it with error-proofing, a control, or a procedure change |
| Vague problem statement | Nothing to measure, so effectiveness cannot be shown | State what, where, when, how many, with data |
| Closing when actions are done | Done is not the same as effective | Close only after the effectiveness check passes |
| Setting effectiveness criteria afterwards | Criteria drift to fit the result | Agree metric, target and period at plan approval |
| Ignoring the escape cause | The same gap lets the next defect through | Ask why inspection did not catch it, and fix that too |
| Containment only | The problem returns when the sorting stops | Containment is step one, never the whole CAPA |
| Opening a CAPA for every minor defect | The backlog hides the serious ones | Use the risk-based triggers in section 3 |
| Accepting supplier responses without evidence | A paper promise is not a changed process | Ask for the revised control plan, data, and audit proof |
| Forgetting related documents | The FMEA and control plan still describe the old process | Update every risk and control document the change affects |
Supplier corrective action requests (SCAR)
IQC findings often lead to a SCAR. Agree the response times in the supplier quality agreement; the schedule below is a common starting point, not a standard.
| Stage | Typical expectation |
|---|---|
| Acknowledge the SCAR | Within 1 working day |
| Containment and sorting of stock at supplier | Within 24 hours of notice |
| Root cause with evidence | 5 to 10 working days |
| Corrective action plan with dates | Within 30 days |
| Effectiveness evidence from the supplier | Agreed monitoring period, then QC verifies at IQC |
Habits that make CAPA work
- —Write the problem statement before discussing causes.
- —Go to the place, look at the part and talk to the people; do not investigate from the office alone.
- —Ask for data at every why. A cause without evidence is a guess.
- —Use a small cross-functional team for any CAPA that crosses departments.
- —Share the lesson across shifts, lines, and sites after closure.
When the effectiveness check fails
A failed check is information, not a failure of the process. Reopen at investigation, test a new hypothesis against the data, record why the first cause was incomplete, and replace or add actions. Do not just extend the monitoring period.
How CAPA, NCR and SCAR link
An NCR records and dispositions a nonconforming item. A SCAR asks a supplier to find and fix its own cause. A CAPA owns the whole investigation and can spawn one or more SCARs. Cross-reference all three records by number, and issue a SCAR when the confirmed cause is within the supplier's process or quality system.
Product impact and measurement reliability
Before root-cause work, assess the impact on shipped product, customer operations, safety, and regulatory compliance, and decide whether a recall or field action is needed. For dimensional problems, check the measurement system first: calibration, gauge resolution, repeatability, and reproducibility.
Escalation authority
Name in the procedure who can place material on hold, approve disposition, notify customers, and approve a risk-based deviation from standard timelines. Without clearly assigned authority, containment may be delayed while responsibilities are clarified.
12. Quick-reference checklist, glossary and references
CAPA checklist
| Done | Check |
|---|---|
| ☐ | Problem described with facts: what, where, when, how many, evidence attached |
| ☐ | Containment done and recorded; suspect stock located and dispositioned |
| ☐ | Risk classified and priority set; due dates agreed |
| ☐ | Root cause found with a named method and supported by evidence |
| ☐ | Escape cause (why it was not detected) identified |
| ☐ | Actions ranked on the strength ladder; owners and due dates set |
| ☐ | Related documents updated: FMEA, control plan, inspection plan, procedures |
| ☐ | Effectiveness metric, target and period defined before implementation |
| ☐ | Effectiveness check run and the data attached |
| ☐ | QA approval for closure; lesson shared with affected teams |
Glossary
| Term | Meaning |
|---|---|
| 5W2H | Who, what, where, when, why, how, how many: a problem-description frame |
| 8D | Eight-discipline team problem-solving format common in automotive supply chains |
| AQL | Acceptance quality limit, a parameter of acceptance sampling; the sampling plan sets sample size and accept/reject criteria |
| CAPA | Corrective and preventive action |
| Cpk | A process capability index comparing process mean and variability with specification limits, subject to the method's assumptions |
| Escape cause | The reason a defect was not caught by inspection or controls (a practical term used in this guide) |
| FMEA | Failure mode and effects analysis, a risk-scoring method |
| IQC / OQC | Incoming/outgoing quality control |
| NCR | Nonconformance report |
| ppm | Defective parts per million |
| RPN | Risk priority number: severity × occurrence × detection, using the scales of the FMEA method in use (classic scales run 1 to 10) |
| SCAR | Supplier corrective action request |
| SPC | Statistical process control |
References
These are standards and regulations named from general knowledge, not fetched for this guide. Confirm clause numbers and current editions before citing them in a procedure or audit response. Authoritative sources: iso.org (ISO standards), fda.gov (QMSR), ich.org (ICH Q10), and iatfglobaloversight.org (IATF 16949). For audits, use the controlled editions and customer-specific requirements.
- —ISO 9001:2015, Quality management systems: Requirements, clause 10.2
- —ISO 9000:2015, Quality management systems: Fundamentals and vocabulary
- —ISO 13485:2016, Medical devices: Quality management systems, clauses 8.5.2 and 8.5.3
- —FDA Quality Management System Regulation (21 CFR Part 820), effective 2 February 2026
- —IATF 16949:2016, clauses 10.2.3 and 10.2.4
- —ICH Q10, Pharmaceutical Quality System, section 3.2.2
- —AIAG and VDA FMEA Handbook (2019) for FMEA scoring