1. Introduction to Root Cause Analysis
1.1 What Is Root Cause Analysis?
Root Cause Analysis (RCA) is a structured, evidence-based process for identifying the fundamental, underlying cause of a problem or undesired event — as opposed to simply addressing the symptoms that made the problem visible. Where ordinary troubleshooting asks “what is broken and how do I make it work again right now,” RCA asks a deeper question: “what allowed this to break, and what needs to change so that recurrence becomes significantly less likely or is reliably detected before causing harm?”
The iceberg model below is a useful way to visualize this distinction. Most people only ever see the tip of the iceberg — the visible symptom. RCA is the discipline of diving below the waterline to examine the immediate cause, the contributing conditions, and ultimately the systemic root cause that produced them all.
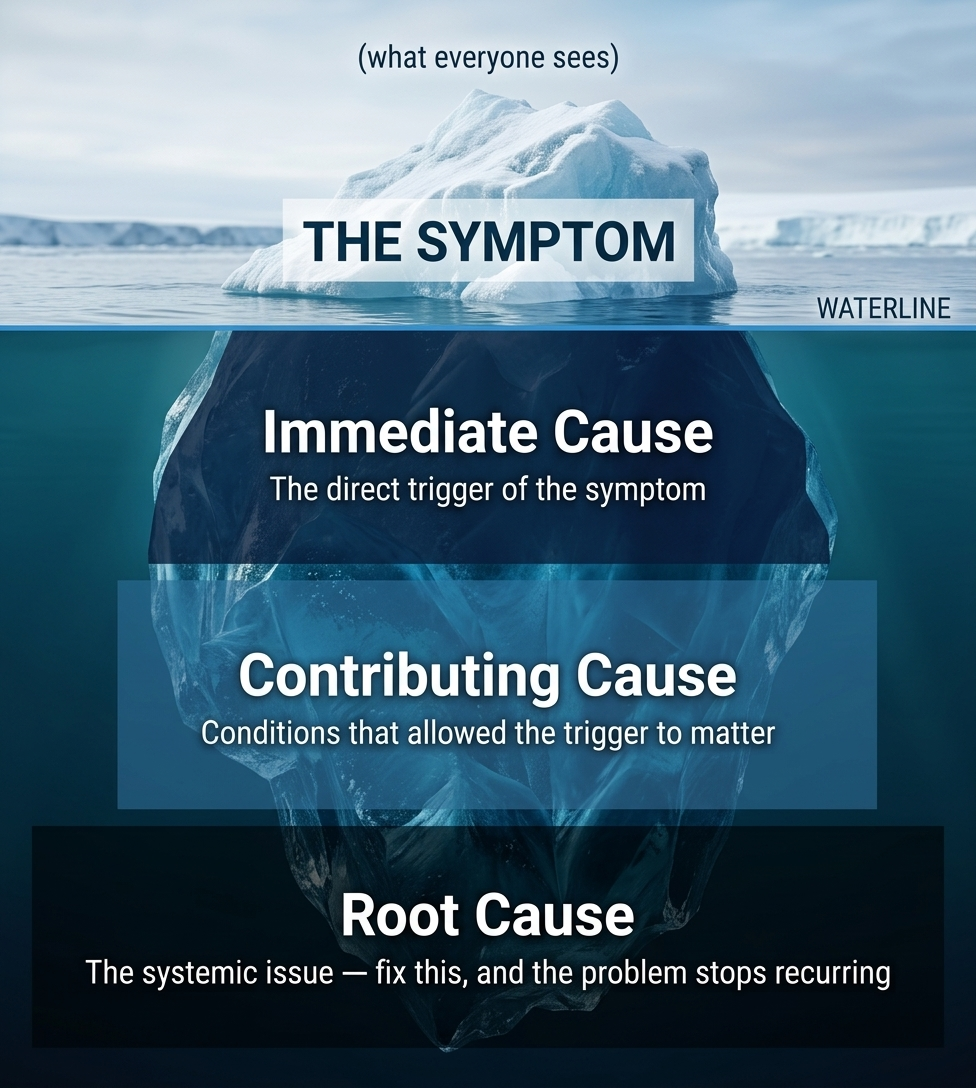
1.2 Symptom vs. Cause vs. Root Cause
These three terms are frequently used interchangeably in everyday language, but in RCA they describe distinct layers of a problem, each requiring a different level of intervention.
| Level | Example | What Happens If You Only Fix This Level |
|---|---|---|
| Symptom | Website is down | It comes back up, then crashes again next week |
| Cause | Server ran out of memory | You add more memory; it fills up again in a month |
| Root Cause | No monitoring or alerting exists for memory usage trends | You add monitoring — the system now catches this class of problem before it recurs |
1.3 Why Root Cause Analysis Matters
- —Stops repeat failures: a fix that doesn't address the root cause is really just a delay before the same problem resurfaces, often in a different form.
- —Is dramatically cheaper than firefighting: catching and fixing a systemic issue once is far less costly than repeatedly patching its symptoms. A commonly cited quality principle, sometimes called the ‘rule of 10,’ suggests that the cost of correcting a defect can increase substantially as it moves from design to production and ultimately to the customer (design → production → field/customer).
- —Builds organizational memory: a well-documented RCA becomes a reference other teams can learn from, preventing the same mistake from being independently rediscovered elsewhere.
- —Shifts culture from blame to systems thinking: good RCA almost never concludes with “an employee made a mistake” — it concludes with “the system allowed that mistake to cause harm,” which is both fairer and far more useful.
- —Is often formally required: many quality and safety frameworks — including ISO 9001, ISO 13485, IATF 16949, and various Six Sigma and safety-management practices — expect organizations to investigate causes and implement appropriate corrective action when significant problems occur.
1.4 When Should You Use RCA?
RCA is worth the time investment when a problem meets one or more of these criteria:
| Criterion | Guiding Question |
|---|---|
| Recurrence | Has this happened before, or is it likely to happen again? |
| Impact | Is the impact significant — safety, financial, reputational, or operational? |
| Non-obviousness | Is the cause unclear? (If it were obvious, you wouldn't need a formal process.) |
| Accountability | Do you need defensible, auditable documentation for compliance or stakeholders? |
Conversely, RCA is usually not worth the overhead for one-off, low-impact, low-recurrence issues — a quick fix and a short note is often the proportionate response there. Knowing when a lighter-weight response is appropriate is itself part of using RCA well.
2. The General Root Cause Analysis Process
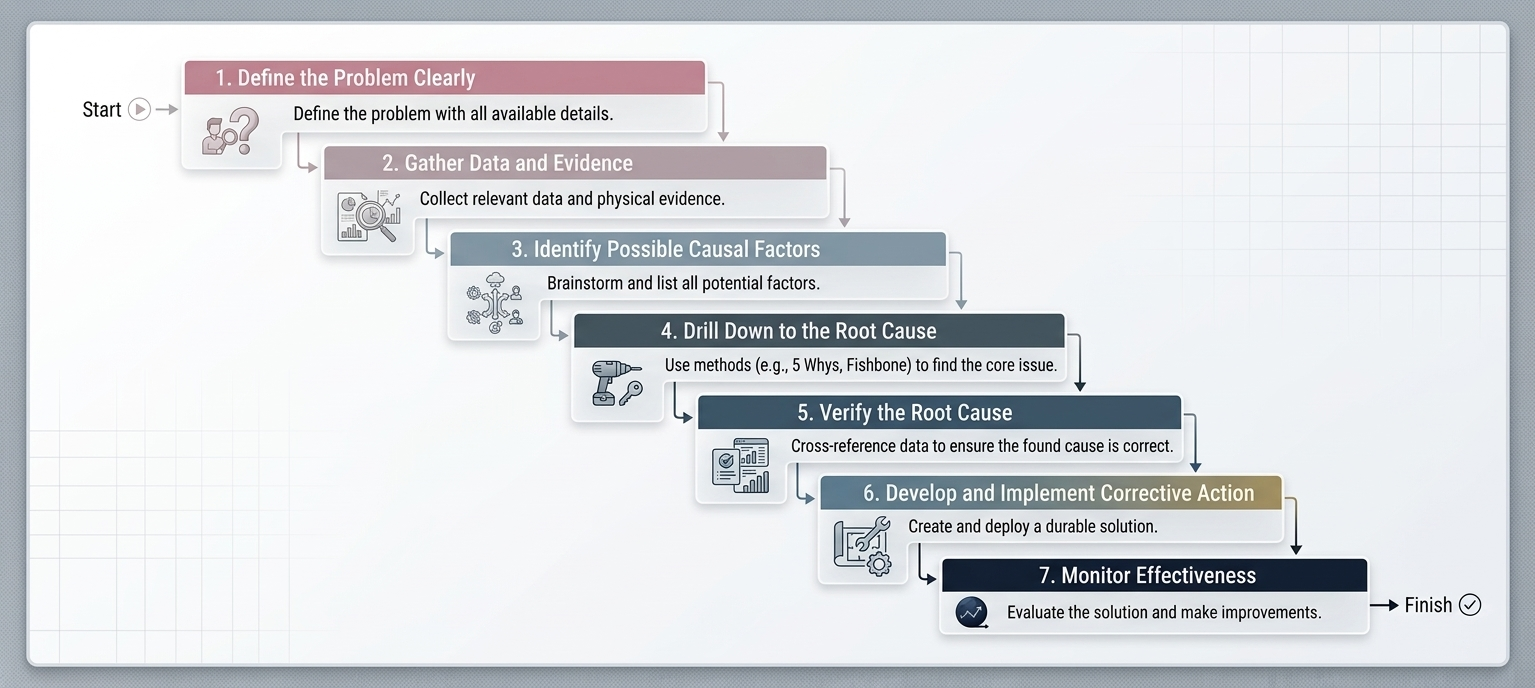
While specific tools and terminology differ by industry, nearly every RCA methodology follows the same overall seven-stage flow, shown below.
2.1 Define the Problem Clearly
Vague problem statements produce vague root causes. A strong problem statement specifies what happened, where, when, how much or how often, and what the expected result should have been. Compare a weak statement — “the product is bad” — against a strong one: “12% of units in batch B-204 failed the drop test at the seam joint, first observed on March 14.” The second version gives an investigator something concrete to trace.
2.2 Gather Data and Evidence
Before theorizing about causes, collect the underlying facts: logs, inspection records, timestamps, photographs, interview notes, process parameters, and any relevant historical data. RCA based primarily on memory or assumptions is essentially guesswork presented in a structured format.
2.3 Identify Possible Causal Factors
Brainstorm every plausible contributing factor without judging or filtering them yet. This is the stage where structured brainstorming tools — most notably the Fishbone Diagram covered in Section 3.2 — are most valuable, because they prevent the investigation from narrowing prematurely onto a single, comfortable explanation.
2.4 Drill Down to the Root Cause
Use a structured method, such as the 5 Whys or a Fault Tree, to move systematically from surface-level causes toward the systemic cause that sits beneath them.
2.5 Verify the Root Cause
Test the hypothesis against evidence. Can the failure be reproduced by recreating the suspected cause? Does removing the suspected cause eliminate the symptom in testing or in a pilot? A genuine root cause should be demonstrable, not merely plausible.
2.6 Develop and Implement Corrective Action
Design an action that directly addresses the verified root cause, and separately consider whether the same root cause could be producing — or could later produce — failures elsewhere in the system. Addressing those other locations proactively is the “preventive” half of a mature RCA/CAPA process.
2.7 Monitor Effectiveness
Track the relevant data after implementation to confirm the problem does not recur over a defined period. If it does recur, the analysis was incomplete — return to Section 2.3 and continue the investigation rather than declaring the case closed.
3. Core Root Cause Analysis Methodologies
There is no single “correct” RCA method — different situations call for different tools. This section covers five widely used RCA techniques in depth, followed by FMEA as a complementary prospective risk-analysis method: conceptual overview, step-by-step execution, a worked example, and practical pitfalls for each.
3.1 The 5 Whys Technique
3.1.1 Conceptual Overview
The 5 Whys is the simplest and most accessible RCA technique available. The method asks “why” repeatedly — not necessarily exactly five times — until the chain of reasoning reaches a systemic cause rather than stopping at a superficial one. It was popularized by Sakichi Toyoda and later embedded into the Toyota Production System, where it remains a foundational lean-manufacturing tool.
3.1.2 Step-by-Step Process
- —State the problem as specifically as possible.
- —Ask why the problem occurred, and write down the answer.
- —Ask why that answer is true, and continue the chain.
- —Stop when the answer describes a process, policy, or system gap rather than a one-off event.
- —Verify the final answer against evidence before treating it as the root cause.
3.1.3 Worked Example
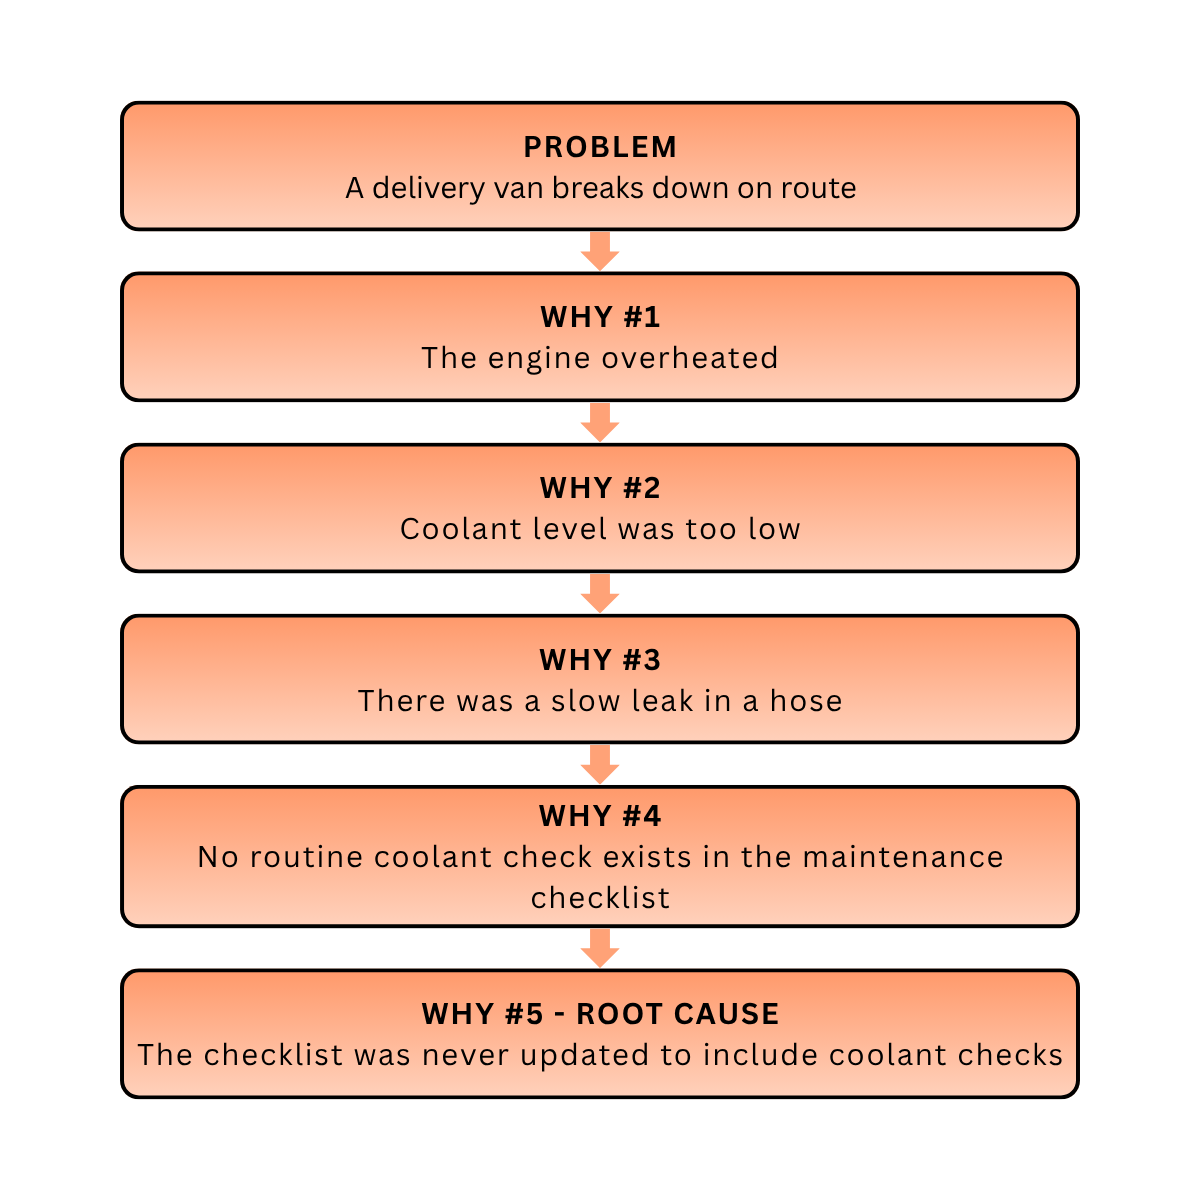
3.1.4 Pitfalls and Trade-offs
- —The method is prone to following a single narrow chain when a problem may actually have multiple, parallel contributing causes.
- —Different investigators can reach different “root causes” for the same problem depending on which answer they choose to pursue at each step — rigor and evidence checking at each stage helps guard against this.
- —It works best for straightforward, linear problems; for complex systems with many interacting components, pairing it with a Fishbone Diagram or Fault Tree first is recommended.
3.2 The Fishbone (Ishikawa) Diagram
3.2.1 Conceptual Overview
Developed by Kaoru Ishikawa, the Fishbone Diagram (also called a Cause-and-Effect Diagram) is best used when a problem could plausibly stem from several different categories of cause. It organizes brainstormed causes into standard categories — commonly the “6 Ms”: Man, Machine, Method, Material, Measurement, and Mother Nature (Environment) — arranged like bones along a spine leading to the effect (the problem) at the head of the diagram.
3.2.2 Step-by-Step Process
- —Write the effect (the problem) in a box at the head of the diagram.
- —Draw the spine and label each major bone with a cause category (the 6 Ms, or categories adapted to the domain, such as the “4 Ps” — Policy, Procedure, People, Plant — used in service industries).
- —Brainstorm specific potential causes under each category and add them as smaller bones.
- —Review the completed diagram as a team and identify the most likely branches.
- —Drill into those branches with a technique like the 5 Whys to confirm the actual root cause.
3.2.3 Diagram
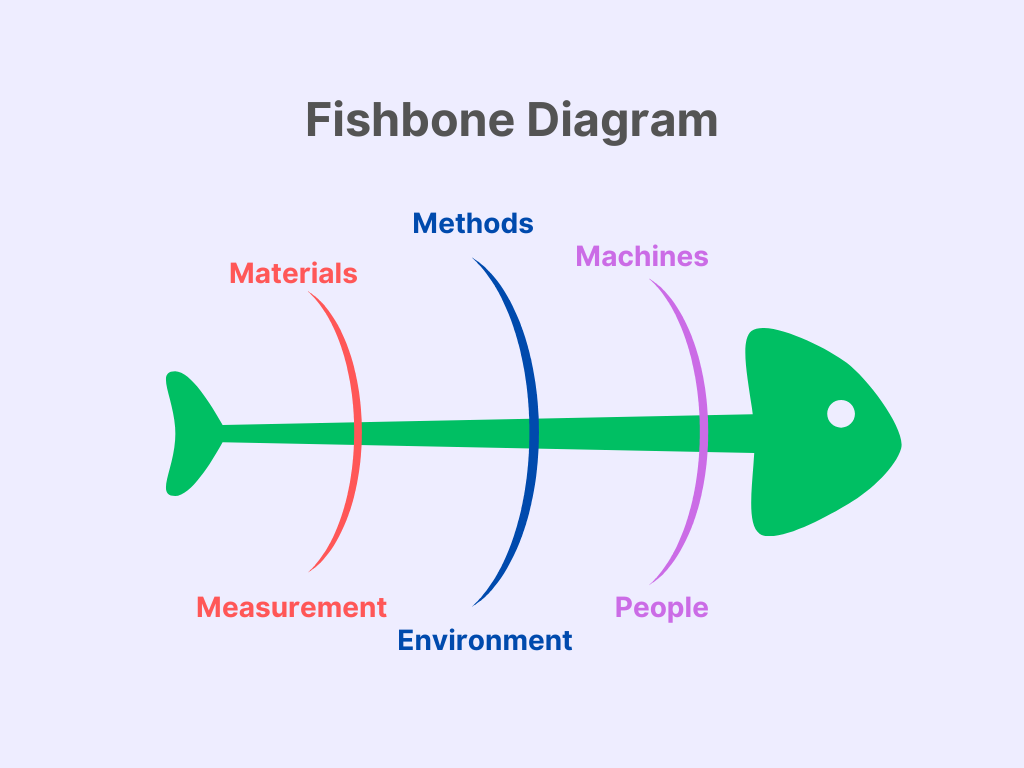
3.2.4 Worked Example
Consider a restaurant kitchen that is consistently slow during dinner service. A Fishbone session might surface: new staff not yet fully trained on the line (Man); one oven running slower than the others, unnoticed (Machine); order tickets not prioritized by cook time (Method); a key ingredient requiring extra prep not accounted for in timing (Material); no one tracking per-dish cook time, so the slow oven goes unnoticed (Measurement); and the kitchen being understaffed during the exact peak window (Environment). The diagram itself doesn't hand over the root cause — it ensures no plausible category gets overlooked before the team drills into the most likely branches.
3.2.5 Pitfalls and Trade-offs
- —Comprehensive but not inherently prioritizing — a Fishbone session can produce a long list of causes without ranking which are most likely, so it should be followed by a focusing technique.
- —Requires cross-functional input to be genuinely useful; a Fishbone built by a single person tends to reflect their own blind spots.
3.3 Fault Tree Analysis (FTA)
3.3.1 Conceptual Overview
Fault Tree Analysis is a top-down, logic-based method widely used in engineering and safety-critical systems (aerospace, nuclear, automotive, medical devices). Analysis starts from the failure itself (the “top event”) and branches downward through logical AND/OR gates to identify the specific combinations of underlying conditions that could produce it.
3.3.2 Step-by-Step Process
- —Define the top event precisely — the specific failure being analyzed.
- —Identify the immediate, necessary, or sufficient conditions that could produce the top event.
- —Connect those conditions to the top event using OR gates (any one condition is sufficient) or AND gates (all connected conditions must occur together).
- —Continue decomposing each branch until reaching basic, independently verifiable events.
- —Optionally assign failure probabilities to basic events to quantify overall risk.
3.3.3 Diagram
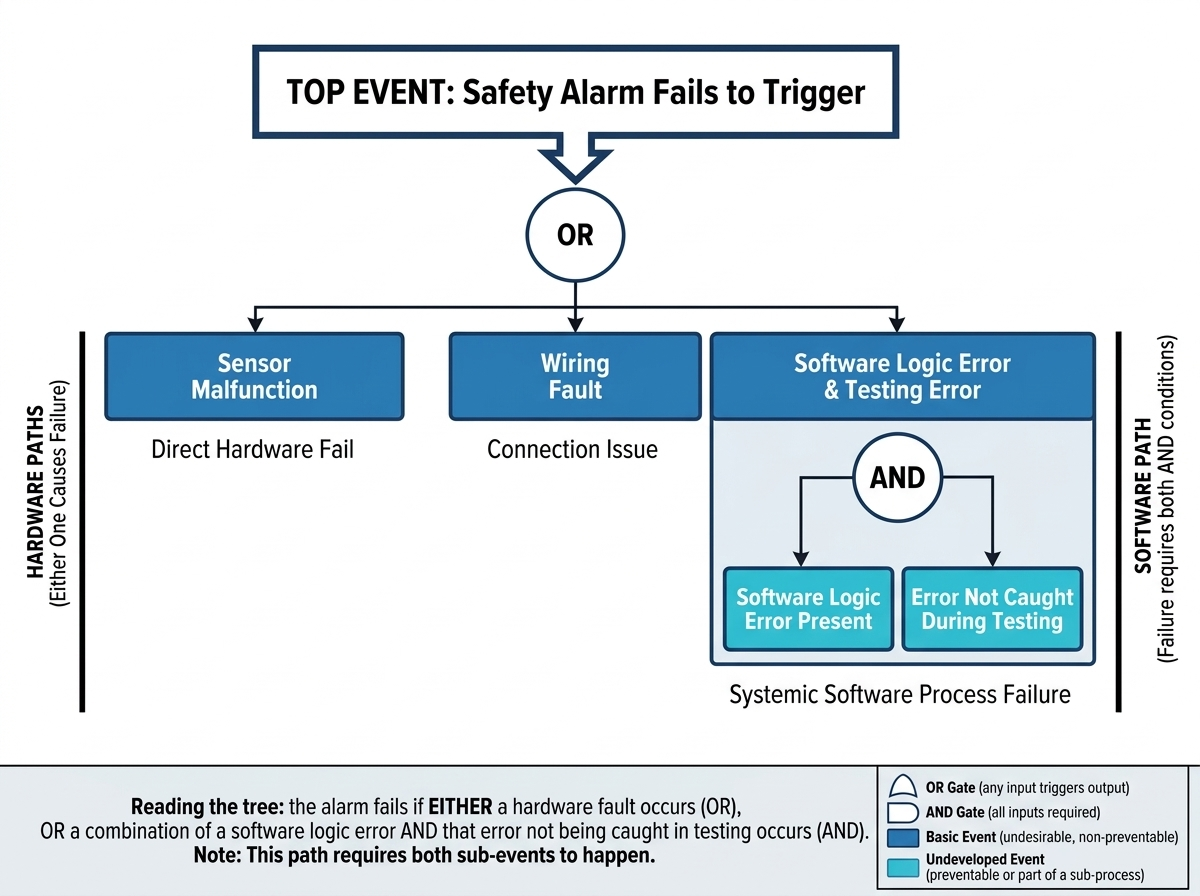
3.3.4 Pitfalls and Trade-offs
- —Rigorous and quantifiable, but time-intensive to build accurately.
- —Requires genuine technical/engineering expertise in the system under analysis — an incorrectly specified gate (using OR where AND applies, or vice versa) silently produces a wrong conclusion.
- —Best reserved for safety-critical or highly complex systems where the investigative rigor is proportionate to the risk.
3.4 Pareto Analysis
3.4.1 Conceptual Overview
Sometimes the challenge is not finding a root cause for one problem — it's deciding which problem deserves RCA attention first. Pareto Analysis ranks issues by frequency or impact, based on the empirical observation (the “80/20 rule,” after economist Vilfredo Pareto) that roughly 80% of effects often stem from about 20% of causes.
3.4.2 Step-by-Step Process
- —Collect frequency or cost data for each category of issue over a defined period.
- —Sort categories from highest to lowest frequency/impact.
- —Calculate the cumulative percentage as categories are added left to right.
- —Plot as a combined bar chart (frequency) and line chart (cumulative percentage).
- —Focus RCA and corrective action effort on the categories that account for the majority of cumulative impact — typically the point where the cumulative line crosses roughly 80%.
3.4.3 Worked Example
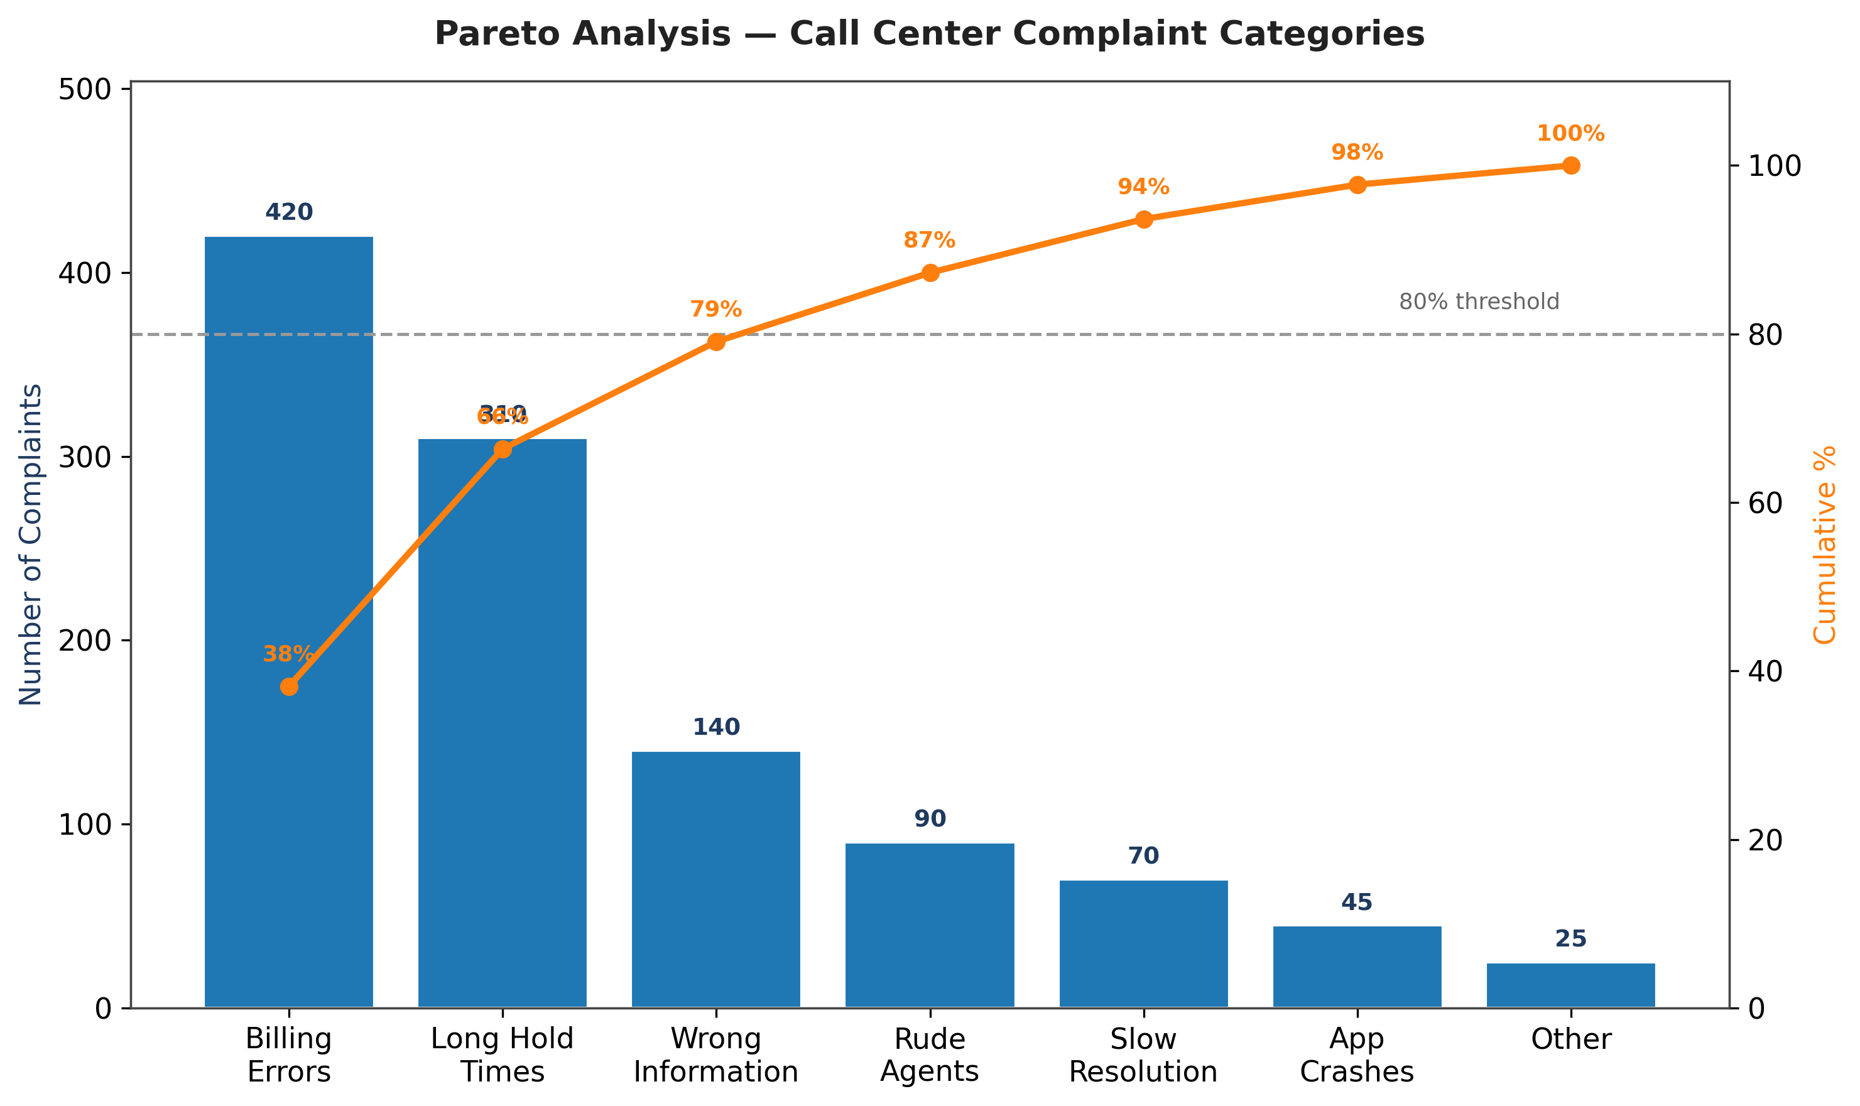
In the example above, “Billing Errors” and “Long Hold Times” together account for the large majority of total complaint volume — telling the team exactly where to focus RCA effort first, instead of spreading investigative effort evenly across every category.
3.4.4 Pitfalls and Trade-offs
- —Pareto Analysis identifies where to look, not why a problem happens — it is a prioritization tool, not a substitute for a deeper causal method.
- —Data quality matters enormously; miscategorized or incomplete records will misdirect priority.
3.5 Change Analysis (Change Point Analysis)
3.5.1 Conceptual Overview
Change Analysis is used when a process was working correctly and then suddenly stopped. Rather than brainstorming broadly, this method compares the current, failing state against the last known-good state and systematically asks: what changed in between?
3.5.2 Step-by-Step Process
- —Identify the last point in time the process was confirmed to be working correctly.
- —List every input, condition, and parameter of the process (materials, people, equipment, environment, procedures, software versions, configurations).
- —Compare each item at the known-good state against its current state.
- —Identify what changed — even changes that seem unrelated or minor.
- —Test whether reverting the change resolves the problem, or whether the change is the necessary trigger in combination with another pre-existing condition.
3.5.3 Worked Example
A bakery's bread suddenly stops rising properly. Change Analysis compares: same recipe? same oven? same yeast supplier? same ambient temperature? Investigation reveals the yeast supplier changed formulations two weeks prior — the one variable that shifted right before the symptom appeared.
3.5.4 Pitfalls and Trade-offs
- —Very effective for sudden-onset problems in a previously stable system.
- —Much less useful for problems that have always existed, or that degraded gradually rather than appearing suddenly, since there is no single clean “before/after” boundary to compare.
3.6 Choosing the Right Method
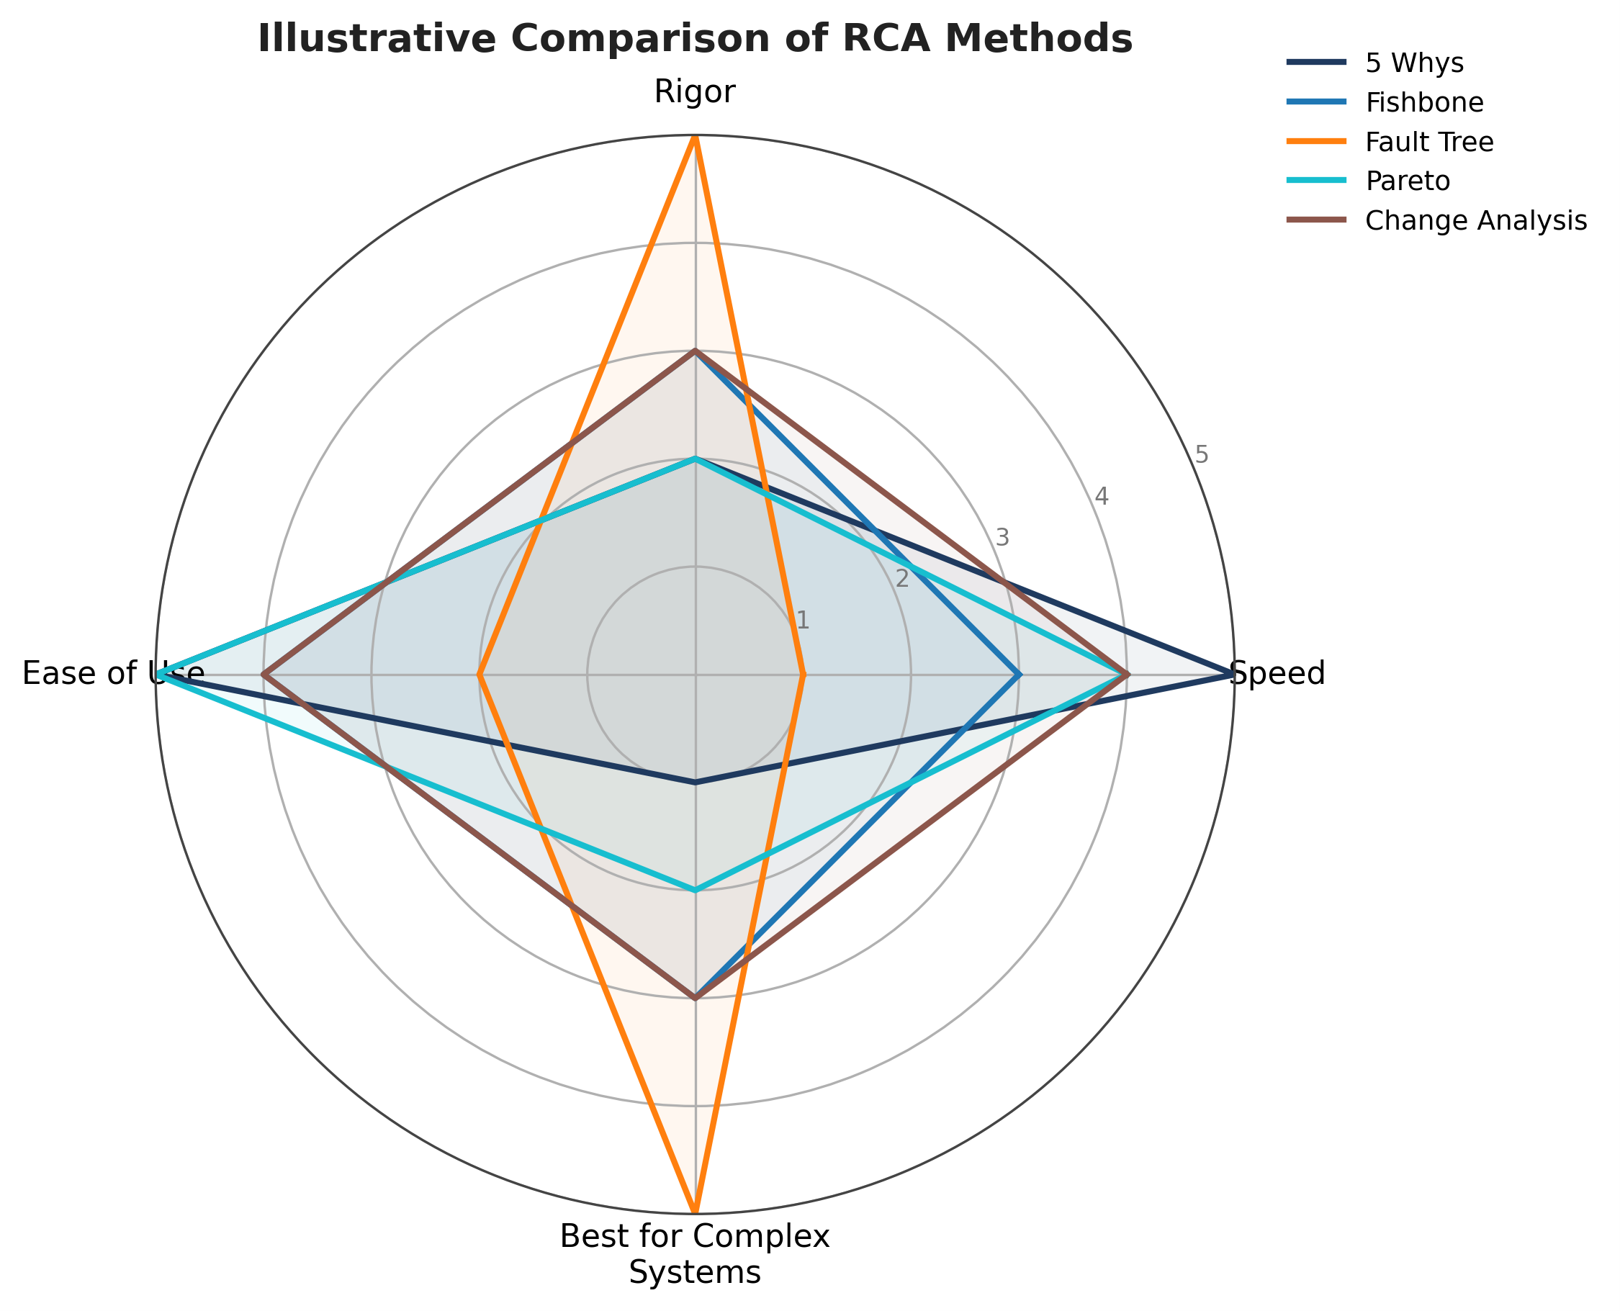
In practice, these methods are frequently combined — for example, using a Fishbone Diagram to map the full space of possibilities, then applying the 5 Whys to the most likely branch to confirm the underlying root cause. The table and chart below summarize when each method is the strongest starting point.
| Situation | Best-Fit Method |
|---|---|
| Simple, single-chain problem | 5 Whys |
| Multiple possible cause categories | Fishbone Diagram |
| Safety-critical or complex systems engineering | Fault Tree Analysis |
| Too many problems, unclear where to start | Pareto Analysis |
| A previously stable process suddenly failed | Change Analysis |
3.7 FMEA: A Complementary, Prospective Approach
Every method covered so far in this section is retrospective — it is applied after a failure has already occurred. Failure Mode and Effects Analysis (FMEA) is the prospective counterpart: instead of explaining a failure that happened, it anticipates ways a product, process, or system could fail before it ever ships, and prioritizes design or process changes to prevent those failures from occurring in the first place.
3.7.1 How FMEA Works
- —List every process step or component, and brainstorm the ways each one could fail (its “failure modes”).
- —For each failure mode, identify its effect on the customer or downstream process.
- —Score each failure mode on three scales, typically 1–10: Severity (how bad the effect is), Occurrence (how likely the failure is), and Detection (how likely existing controls are to catch it before it causes harm).
- —Traditional FMEA approaches may calculate a Risk Priority Number (RPN = Severity × Occurrence × Detection). Modern approaches, such as AIAG-VDA FMEA, use Action Priority (AP) rather than relying solely on RPN.
3.7.2 How FMEA and RCA Fit Together
FMEA and RCA are two halves of the same discipline, running in opposite directions. FMEA asks “what could go wrong, and how do we stop it before it does?” RCA asks “this went wrong — why, and how do we stop it from happening again?” A mature quality system runs both in a closed loop: a thorough FMEA reduces how often RCA is ever needed, and every RCA finding should feed back into updating the relevant FMEA. If an RCA uncovers a root cause that the FMEA never anticipated, that is itself a gap in the risk assessment — closing that gap is part of the preventive action, not a separate exercise.
| Dimension | RCA (Retrospective) | FMEA (Prospective) |
|---|---|---|
| Trigger | A failure has already occurred | Conducted before failures occur, during design or process planning |
| Core Question | Why did this happen? | What could go wrong, and how likely/severe/detectable is it? |
| Typical Output | A verified root cause and a corrective/preventive action | A ranked list of risks (by RPN) with mitigations for the highest-priority items |
| When It's Used | After an incident, complaint, or audit finding | During new product introduction, process design, or periodic risk reviews |
4. Common Pitfalls in Root Cause Analysis
Even experienced teams fall into these traps repeatedly. Recognizing them is often the difference between an RCA that actually prevents recurrence and one that merely produces paperwork.
- —Stopping at the first plausible answer: the first “why” is rarely the root cause — it is usually just the most visible one.
- —Confusing correlation with causation: two things happening around the same time does not mean one caused the other; the link must be verified before concluding.
- —Blaming people instead of examining systems: “operator error” is almost never a root cause on its own — the more useful question is why the system allowed that error to result in a failure.
- —Skipping verification: a root cause should be tested, not just theorized; if the causal link cannot be demonstrated, the investigation is not yet finished.
- —Treating RCA as a one-time event: the final step — monitoring effectiveness — is often skipped, meaning teams never learn whether their “root cause” was actually correct.
- —Treating RCA as paperwork rather than culture: if a team treats RCA as a form to close a ticket rather than a genuine investigation, causes get sanitized to close the case quickly, and the real issue quietly returns.
4.1 Avoiding the Operator-Error Trap: Poka-Yoke and System Design
It is tempting to close an investigation with “the operator made a mistake” — but this rarely qualifies as a root cause, since it explains what happened without explaining why the system allowed it to happen. A more productive question is: what would have to be true for this mistake to be physically impossible, or at least immediately obvious, the next time?
This is the thinking behind Poka-Yoke, a term coined by Japanese industrial engineer Shigeo Shingo meaning “mistake-proofing” or “error-proofing.” Rather than relying on vigilance, training, or warning signs — controls that depend on a human remembering to act correctly every time — Poka-Yoke builds constraints directly into the process or equipment so that the error either cannot occur, or is caught the instant it does.
- —Prevention-based Poka-Yoke: the design makes the incorrect action physically impossible — for example, an asymmetric connector that can only be inserted one way, or a fixture that only accepts a correctly oriented part.
- —Detection-based Poka-Yoke: the incorrect action can still occur, but the system immediately flags it before the unit proceeds further — for example, a sensor that confirms a fastener was actually torqued, or a barcode scan that blocks assembly if the wrong component variant is presented.
When an RCA points toward human action as a contributing factor, treating that as the root cause and simply retraining the operator is usually an incomplete fix — training fades, and shift changes or new hires reintroduce the same risk. The more durable corrective action asks whether a prevention- or detection-based safeguard can remove the possibility of the mistake mattering at all.
5. A Complete Worked Example, Start to Finish
The following example walks through the entire RCA process applied to an electronics manufacturing failure, showing how the stages connect in practice. Problem statement: during final functional testing, an increasing number of assembled units began showing an intermittent LCD blinking issue — the display flickered on and off randomly during the burn-in test, starting with a specific production batch.
| Stage | What Happened |
|---|---|
| 1. Define | 6.5% of units from Batch #B-4471 failed final QC due to intermittent LCD blinking during the 30-minute burn-in test, first observed on the morning shift of August 18. |
| 2. Gather Data | Pulled QC inspection logs, SMT line parameters, FPC (flexible printed circuit) connector torque/placement records, incoming inspection (IQC) data for the LCD and connector batch, and burn-in test videos of failed units. |
| 3. Causal Factors | Considered categories across the 6Ms: Man (assembly technician handling), Machine (SMT/reflow calibration, connector press-fit tooling), Method (assembly work instruction), Material (LCD panel batch, FPC connector batch), Measurement (burn-in test sensitivity), Mother Nature/Environment (humidity/ESD at the assembly station). |
| 4. Drill Down | Cross-referencing failed unit serials showed all failures traced to a single FPC connector reel received from a new supplier lot two days prior. Micro-sectioning the connector showed slightly out-of-spec contact pin height, causing an intermittent connection under thermal expansion during burn-in. The incoming inspection checklist did not include pin-height verification for FPC connectors — only visual and continuity checks were performed. |
| 5. Root Cause | Incoming inspection (IQC) criteria for FPC connectors did not include a dimensional check (pin height) capable of catching this specific supplier-side variation. |
| 6. Corrective Action | Quarantined and reworked all units from the affected connector lot; reseated or replaced connectors and re-ran burn-in on reworked units. |
| 6b. Preventive Action | Updated the IQC checklist to include pin-height dimensional verification for all FPC connector lots; required the connector supplier to submit a Certificate of Analysis (CoA) with dimensional data for every future lot. |
| 7. Verify | Monitored LCD-blinking failure rate across the next four production batches (approx. 3 weeks) to confirm the failure rate returned to baseline (<0.5%) and did not reappear in later batches using different connector lots. |
6. A Standard RCA Report Template
To make RCA findings auditable, comparable across cases, and useful to future investigators, most mature quality systems require every RCA to be documented using a standard template. The checklist below covers the fields expected in a typical enterprise RCA report.
| Field | Purpose |
|---|---|
| Report ID / Case Number | Unique identifier for traceability across the CAPA, ERP, or quality database. |
| Date Reported / Date Opened | When the issue was first identified. |
| Containment Date | When immediate containment action was completed (Section 2.2). |
| Problem Description | The specific, measurable problem statement (Section 2.1). |
| Affected Product / Process / Batch | The exact scope of impact — what is affected and what is not. |
| Root Cause Category | A standardized category, such as one of the 6Ms, enabling trend reporting across many RCAs over time. |
| Root Cause Statement | The verified, specific root cause — not a symptom or immediate cause. |
| Analysis Method(s) Used | Which tool(s) were applied — 5 Whys, Fishbone, FTA, Pareto, Change Analysis, or a combination. |
| Corrective Action | The fix addressing this specific occurrence. |
| Preventive Action | The broader fix addressing everywhere else the same root cause could apply. |
| CAPA Owner | The named individual accountable for implementation. |
| Target Completion Date | The deadline for corrective/preventive action implementation. |
| Verification Method & Period | How, and for how long, effectiveness will be monitored (Section 2.7). |
| Verification Result | The outcome of the monitoring period — confirmed effective, or reopened for further analysis. |
| Approval / Sign-off | Sign-off from the quality lead or relevant authority formally closing the record. |
7. Conclusion
Root Cause Analysis is not fundamentally about cleverness — it is about the discipline to keep asking “why” past the point where most investigations stop. The objective is never simply to explain what happened; it is to change the system so that this category of problem becomes structurally less likely to happen again.
Whether the context is software, manufacturing, healthcare, or any process-driven work, the same principle holds:
Symptoms tell you something is wrong. Root causes tell you what to actually change.